Analista incansable
Every day it watches a list of stocks, scores each company on its fundamentals and flags anything worth a second look. It analyses and watches; it never predicts or trades.
- Period
- 2026
- Team
- Personal project
- Context
- Runs on my Ubuntu server, inside a private network
- My role
- The whole project
- Tech stack
- Python
- pandas
- yfinance
- SQLite
- FastAPI
- Jinja2
- n8n
- Telegram

What it does
- Downloads daily prices and annual statements into SQLite. Missing data is shown as “n/a”: it is never invented.
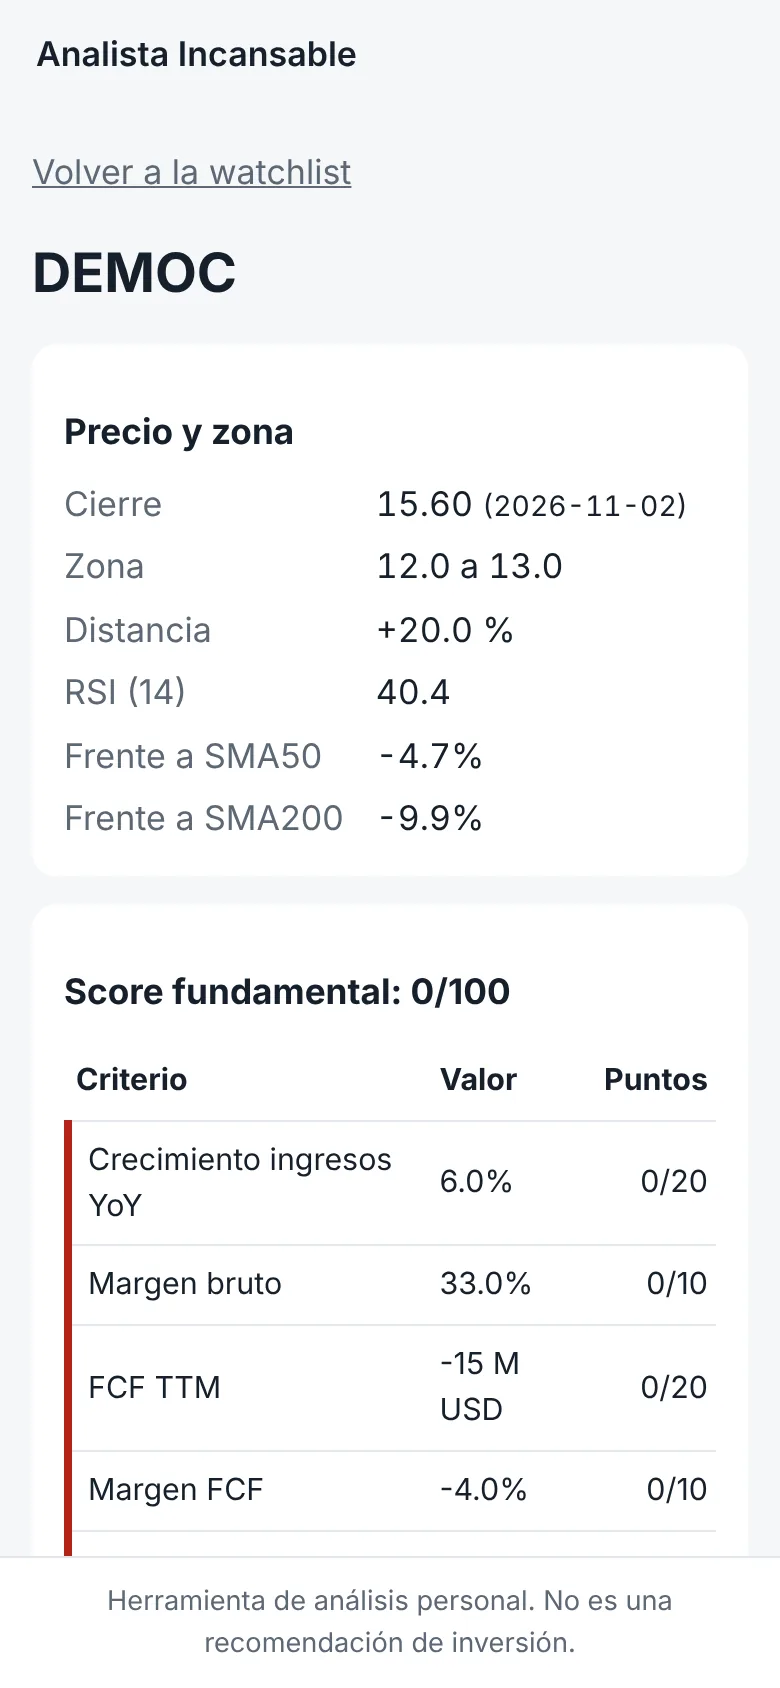
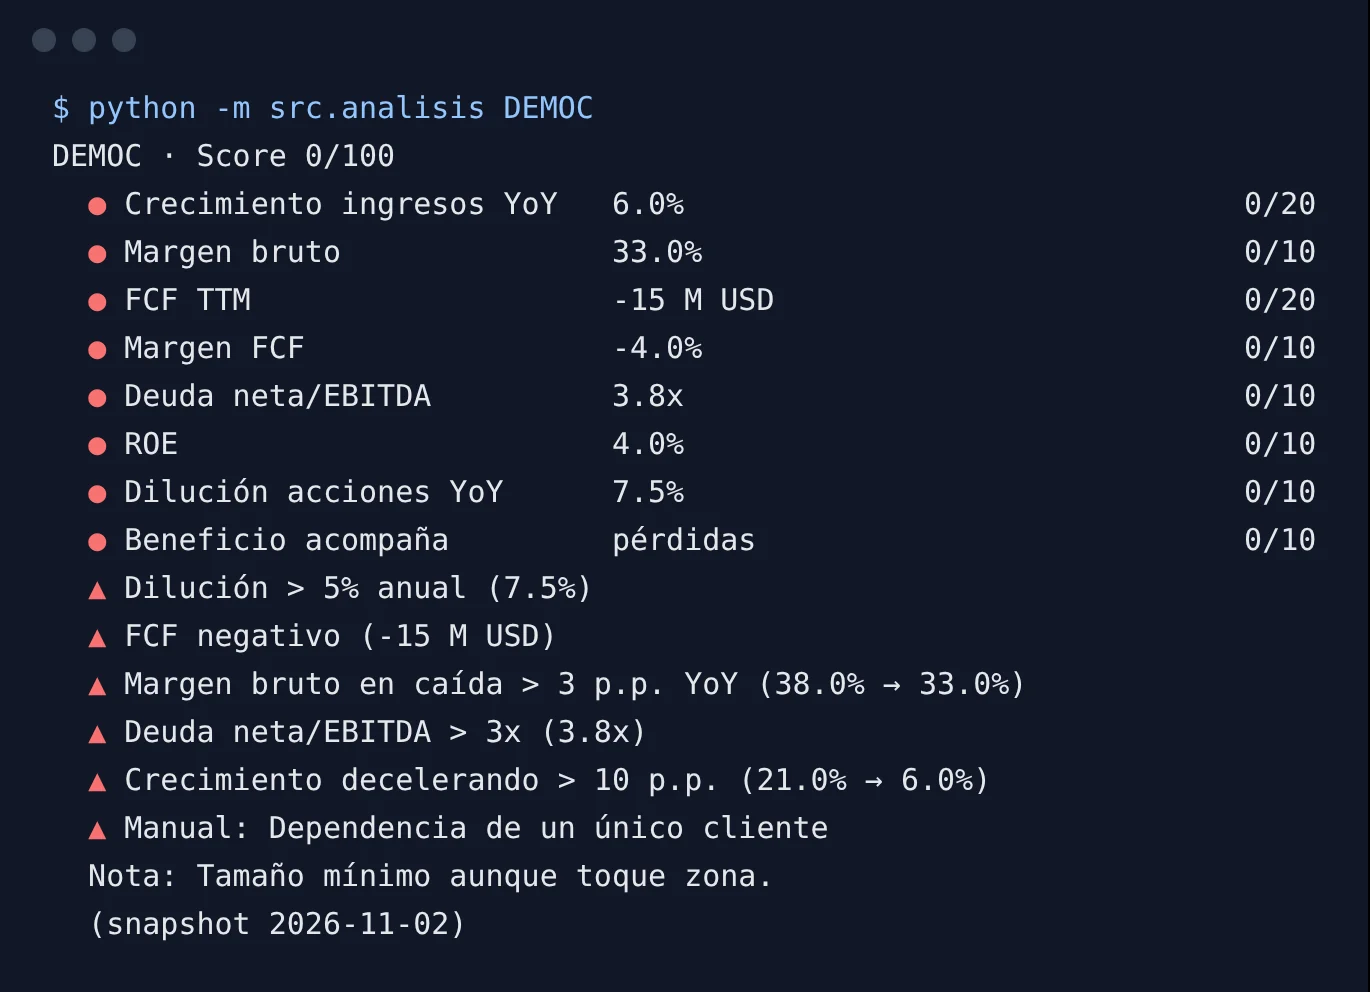
- Scores each company from 0 to 100 on eight criteria and lists red flags separately.
- Alerts when a stock enters its zone or gets within 3%, crosses the 200-day average or gets a new red flag.
- Every zone alert includes the latest headlines and the manual note for the stock.
How it is built
- Weights and thresholds in YAML, to tune the method without touching code.
- An anti-spam table stops the same alert repeating for 5 days.
- JSON output for an n8n workflow, or straight to the Telegram API.
- A FastAPI panel with no write endpoints and a demo mode with synthetic data.
The score
| Criterion | Green | Amber | Weight |
|---|---|---|---|
| Revenue growth | > 20 % | 10 to 20% | 20 |
| Gross margin | > 50 % | 35 to 50% | 10 |
| Free cash flow | positive and growing | positive | 20 |
| FCF margin | > 10 % | 5 to 10% | 10 |
| Net debt / EBITDA | < 1x or net cash | 1 to 3x | 10 |
| ROE | > 15 % | 8 to 15% | 10 |
| Annual dilution | < 2 % | 2 to 5% | 10 |
| Earnings keep up | grow with revenue | positive but slower | 10 |
Green earns the full weight, amber half, and red or missing data zero. Red flags are listed separately and never averaged away.
Gallery


Let’s talk
I’m from Seville and now live in Madrid. I like things to work end to end: designing the system, writing the code, deploying it and measuring whether it really holds up.
If you’re looking for someone for backend, data or applied AI work, write to me and I’ll get back to you.